


Older Raspberry Pi’s, like the Raspberry Pi 2’s and 3’s, while slow compared to the newer versions, are still extremely useful for some applications. I happened to have one of each laying around and decided to use one to build a custom weather forecast to suit my individual needs.
To be honest, this project doesn’t really need a Raspberry Pi, but I wanted to be able to access the custom weather forecast from any device in my household connected to my local network. Feel free to use it without implementing the Raspberry Pi steps.
Why I Created The Custom Weather Forecaster
I like water sports. I’m also very aware of the dangers of paddling out into the open ocean without a firm knowledge of expected weather conditions. I already use a public tool for this, Ventusky.com. Ventusky is great because I can look at wind and wave directions and speeds on an hour by hour basis. I know what to expect for the daily conditions, and where I should or should not go paddling.
However, looking several days ahead to try and plan which days might be favorable for a paddle become a little cumbersome. I tried other wind/marine and weather apps, but most had cluttered interfaces or to much irrelevant information. Some also cost money to use. I’m not sure about you, but I will never spend a dime to find out what the weather is going to be!
I came up with the idea of a chart which plots the wave and wind data. This would make it much easier and faster to know what are the potentially good paddling days for the coming week. Once the high potential days are known, then I could use Ventusky to drill down into the details.
Data Source for My Custom Weather Forecaster
Before building the custom weather forecaster I needed to find a data source that provided relevant weather data for my area, including marine data. It also needed to be free!
After a short search and some initial testing I decided to go with Open-meteo. Among several other API’s, Open-meteo includes your regular weather forecast API, as well as a Marine Weather API.
Visualizing the Custom Weather Forecast Data
Based on my location, there’s a few things that make a good paddling day. These include:
- Wind direction. A safe wind direction is generally from the East, with NW to SSE being a safe range (blowing direction). These directions will have me hit land, eventually, if something happens – like a lost paddle for example.
- Wind speed lower than 10 to 12 kph. Anything higher and paddling is not as much fun.
- Low ~ish wave height. I like less than 0.5 meters. Higher is ok, but not too much. Direction is not that important since wave refraction will generally pull the waves in anyways (in my area). In some rare cases with a “direct offshore” wave direction it may not refract and I won’t see it, but I decided to not add this as an indicator.
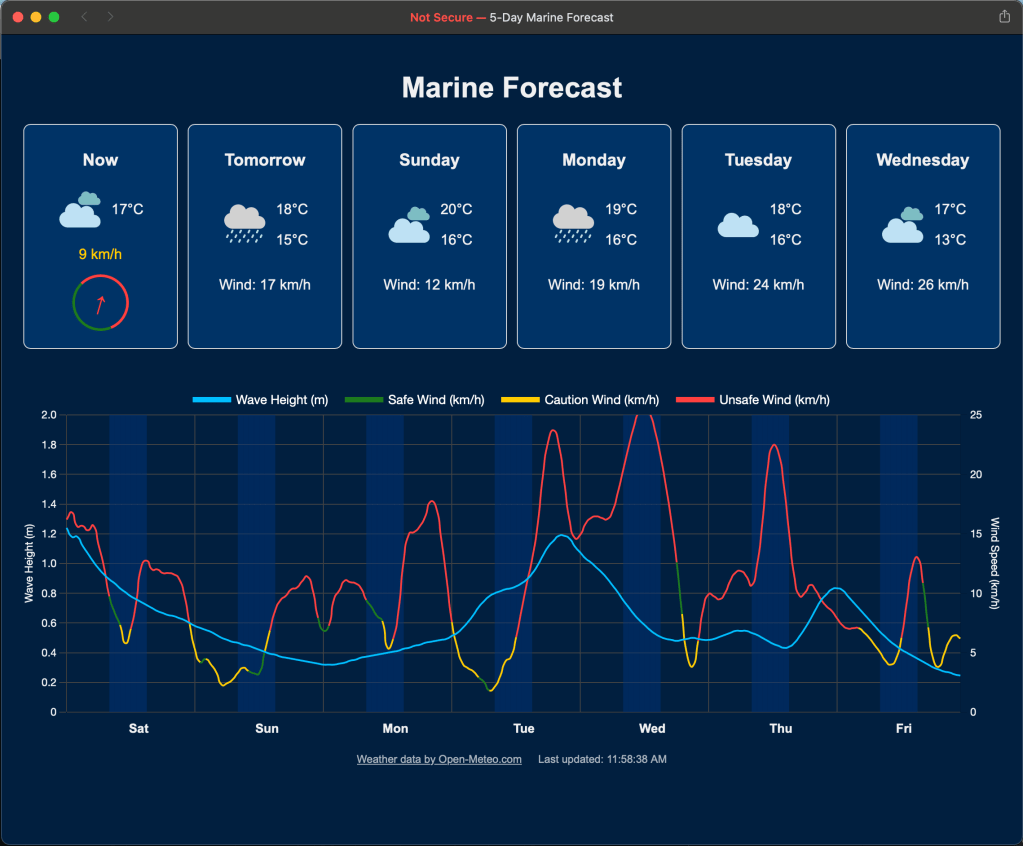
My idea was to be able to glance at the screen, and within a few seconds, know which days might be favorable. I decided to go with a line chart and plot both the wind and the waves. I also had the idea to change the color of the wind speed line to indicate weather the wind was safe or not. Here’s what it all looks like:
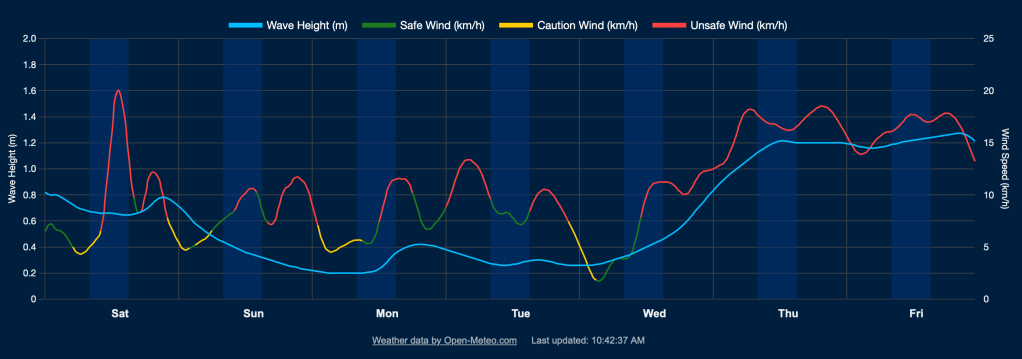
Wind: The plot is either red, yellow, or green. The line will be green if the wind direction is below a certain value regardless of the direction, yellow if the speed is below the threshold but in an unsafe direction, and red if the speed is over the threshold.
Wave: The wave height is plotted as an unchanging solid blue line.
Scale: The vertical axis scale is fixed. I found that having the y-axis auto-scale messes with your perception of the relative values of the plots. I don’t need to know if the wind speed or wave height values are over a certain value. If they’re outside of the range, it’s not a paddling day anyways. I prefer the consistent scale so my perception of the forecast doesn’t change week to week.
Background: I usually only go paddling between 8am and 3pm, so highlighted those times on the chart. I could have truncated the times I don’t need, but I find it useful to know what the conditions are before and after. It adds to my knowledge of the overall conditions, adding an extra element of safety.
Thresholds: The values that trigger what is safe or unsafe are configurable, along with the location. I’ll cover how to change these later on in this post.
General Conditions
I also wanted to know what the general conditions were, as well as the general forecast. I decided to use the API data to add these:

The “Now” conditions include a colorized wind direction and speed indicator. It uses the same thresholds as the chart to show safe or unsafe conditions.
How it Works
I’ll cover some of the basics here. The full code can be found in this Github repository. If you’re not sure how to get the code downloaded and installed, I’d suggest using ChatGPT for instructions.
The Data Source
The Open-meteo API uses a basic http request and a JSON response format. For example, this request: https://api.open-meteo.com/v1/forecast?latitude=38.7833&longitude=0.1667&hourly=temperature_2m,wind_direction_10m&forecast_days=3 for a 3 day forecast which includes some very basic wind and temperature details, returns a format like this (values truncated for readability):
{
"latitude":38.75,
"longitude":0.1875,
"generationtime_ms":0.026941299438476562,
"utc_offset_seconds":0,
"timezone":"GMT",
"timezone_abbreviation":"GMT",
"elevation":13.0,
"hourly_units":{
    "time":"iso8601",
    "temperature_2m":"°C",
    "wind_direction_10m":"°"
},
"hourly":{
    "time":[
        "2025-04-05T00:00",
        "2025-04-05T01:00",
        "2025-04-05T02:00",
        ...
    ],
    "temperature_2m":[
        15.0,
        14.8,
        14.5,
        ...
    ],
    "wind_direction_10m":[
        333,
        330,
        323,
        ...
    ]
}
}
The marine forecast response is basically the same, just different data.
The Code
The code is basic html, JavaScript, and some CSS. It uses the Chart.js library for the chart component. I also used some stock icons for the weather type.
Parameters and Thresholds Settings
These are a bit disjointed at the moment. I plan to consolidate all of these into a single area or file, and front-end setting at some point.
The wind parameters are captured in the windSafetyCongig constant:
const windSafetyConfig = {
    // Safe wind direction range in degrees (NW to SSE = 315° to 157.5°)
    minSafeDirection: 315, // NW
    maxSafeDirection: 157.5, // SSE
    // Wind speed limits in km/h
    lowWindSpeedLimit: 7,  // Below this, direction is less important (yellow)
    maxSafeSpeed: 9,       // Maximum safe wind speed
    // Colors for the wind line
    safeColor: "#1e7b1e",    // Green
    cautionColor: "#ffcc00", // Yellow for low speeds from unsafe directions
    unsafeColor: "#ff4040"   // Red
};
The Latitude and Longitude settings, along with the timezone live in the fetchWaveForecast() and fetchRegularForecast() functions:
async function fetchWaveForecast() {
    const url = "https://marine-api.open-meteo.com/v1/marine";
    const params = new URLSearchParams({
        latitude: 38.781155, // 38.7833,
        longitude: 0.197843, // 0.1667,
        hourly: "wave_height",
        timezone: "Europe/Berlin"
    });
    const response = await fetch(`${url}?${params}`);
    return response.json();
}

async function fetchRegularForecast() {
    const url = "https://api.open-meteo.com/v1/forecast";
    const params = new URLSearchParams({
        latitude: 38.781155, // 38.7833,
        longitude: 0.197843, // 0.1667,
        current: "temperature_2m,weather_code,wind_speed_10m,wind_direction_10m",
        hourly: "wind_speed_10m,wind_direction_10m",
        daily: "weather_code,temperature_2m_max,temperature_2m_min,wind_speed_10m_max",
        timezone: "Europe/Berlin"
    });
    const response = await fetch(`${url}?${params}`);
    return response.json();
}
That’s about it really. There’s a lot more code in there, but it basically just fetches the general and marine forecasts, then renders them on the page. It then updates the chart every 10 minutes with a new API call for the latest information.
Viewing the Weather
Double click the index.html file to open it in the browser. That’s it!
You can leave it open and it will update every 10 minutes, or, close the browser tab or window and run the file whenever desired. Optionally, see the next section for running the code on a Raspberry Pi connected to your local network.
Serve Your Custom Weather from a RaspBerry Pi
This step is optional, but gives you the advantage of being able to access your custom weather forecast from any device connected to your home network.
You can use any Raspberry Pi model for this, even some of the older ones. I run mine on an old Raspberry Pi 2 Model B. Even with a couple of other background tasks running, it easily handles this.
I won’t show the details on how to get it set up and working, this is already well documented in the official documentation. In my case I set it up headless and connect to it via SSH. In general, follow these steps:
- Setup the OS using the imager software as described here. When choosing which OS to use, go for the latest one recommended for your device, but choose the “lite” version. We don’t need any desktop functionality.
- After adding the OS image to the SD card, insert it into the RPi, connect it to your router, and power it up.
- Figure out the RPi’s IP address and access it via SSH as described here. Again, ChatGPT is your friend here if you’re a little lost.
- When you’re connected via SSH, go through the configuration options in raspi-config as shown here.
Now you’re ready to get the custom weather forecast files copied over and setup the server. In these steps I’ve assumed the username is username. Replace all instances of this with your actual username. In most default RPi setups, it’s pi.
From the SSH terminal, install nginx:
sudo apt-get updatesudo apt-get install nginx -y
Now you want to copy the files over to the RPi. The easiest way is to clone the repository, though if you’ve already edited the files on your computer and want to use those you can use the scp command. I’m going to show the clone method, but ChatGPT is more than willing to help you with the scp command if you want to use that option.
Install git and clone the repository:
sudo apt-get install git -ygit clone https://github.com/nickpagz/marine-forecast.git
Note we’re installing the files to the home directory to avoid permission issues. We’ll add an alias in the nginx configuration files to point here.
Setup the nginx configuration file using the following settings. Make sure to change to your relevant server name and username values. The server name is usually raspberrypi.local for default setups:
sudo nano /etc/nginx/sites-available/default
Edit the file, or delete it all and paste in the following:
server {
    listen 80;
    server_name raspberrypi.local;

    location /weather/ {
        alias /home/username/marine-forecast/;
        index index.html;
        try_files $uri $uri/ =404;
    }

    location / {
        root /var/www/html;
        index index.html index.htm;
        try_files $uri $uri/ =404;
    }
}
Make sure nginx has the correct permissions:
sudo chown -R www-data:www-data /var/www/html/weathersudo chmod -R 755 /var/www/html/weather
Check the nginx configuration file for errors:
sudo nginx -t
If we’re error free, restart the nginx service:
sudo systemctl restart nginx
You should now be able to access your weather at http://raspberrypi.local/weather/
… or whatever your actual server name is.
If you encounter a permission denied error, try running these commands:
sudo user mod -a -G username www-datachmod g+rx /home/usernamechmod -R 755 /home/username/marine-forecastsudo systemctl restart nginx
Bonus for Mac Users: Add as a Web App to the Dock
If you’re on a Mac you can add a link to the custom weather forecast in the dock. To do this, open the url in Safari and click on the Share logo/button in the top right corner of the browser window and click on Add to Dock:
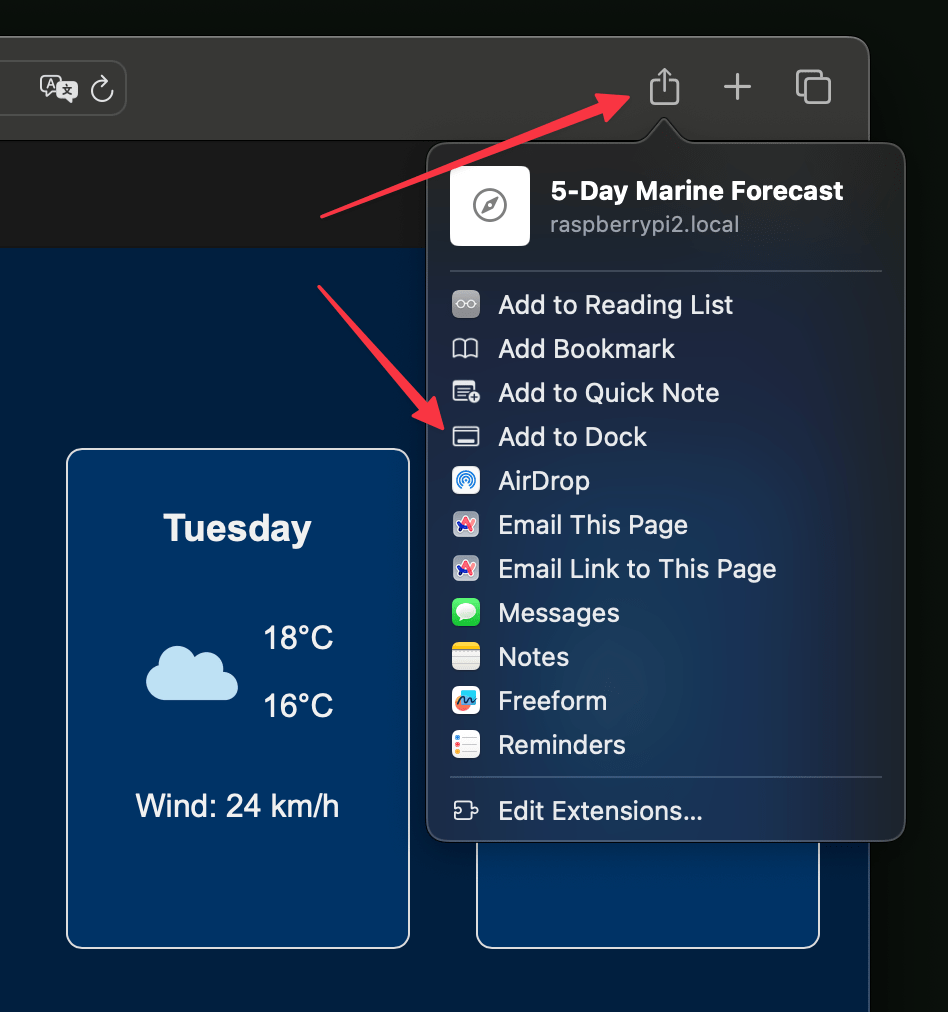
Adjust the app name as needed, then click on the Add button. After you’ve added it as app, launch it and in the settings menu for the app you can change the icon if you want.


Leave a comment